[시각화 스터디] 2021 Week 10 Tableau : Can you build a must include filter?
작성자 : 최민경
https://www.workout-wednesday.com/2021/03/09/2021w10tab/
2021 Week 10 | Tableau: Can you build a must include filter? – Workout Wednesday
This week’s challenge is pulled directly from a work challenge I encountered recently. The ask was to build a filtering system that would allow the user to initially filter data and then add a secondary requirement of inclusion. Using the Superstore da
www.workout-wednesday.com
1. 데이터소개

Superstore 데이터로 고객ID와 고객이 주문한 상품과 날짜 등을 포함하고 있는 데이터이다.
2. 분석목표
filter기능을 사용하는 것이 목표이다. 첫번째 필터링을 거친 다음 나온 데이터를 바탕으로 두번째 필터링까지 진행하는 것이 목표이다.
3. Requirements
- Dashboard Size: 1200px by 900 px
- # of Sheets – up to you
- Create functionality that allows the user to filter to products and then require another product to be a part of the order
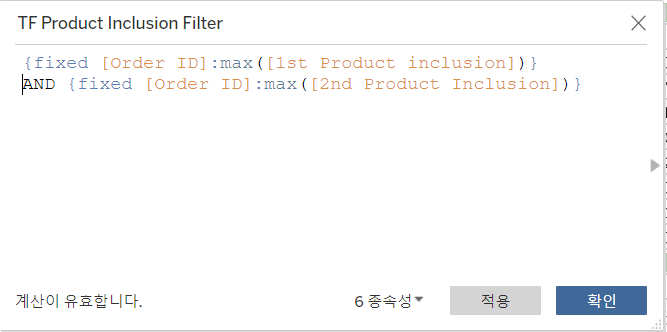
제품을 포함하는지의 여부를 True또는 False의 값으로 반환하는 새로운 계산된 필드인 1st Product Inclusion과 2nd Product Inclusion을 만든다. 그리고 1st와 2nd를 둘 다 포함해야지 True를 반환하는 TF Product Inclusion Filter를 만든다.

집합인 1st Product와 2nd Product는 클릭할 수 있도록 집합표시를 한 뒤, 드롭다운 형식으로 바꾸어준다.
- Create a bar chart that shows Order ID, Customer, Sales, and Quantity total

Order ID와 Customer Name은 행에, Quantity와 Sales의 합계를 열에 위치시킨다.
- Should show detail of what was included in the order within tooltip
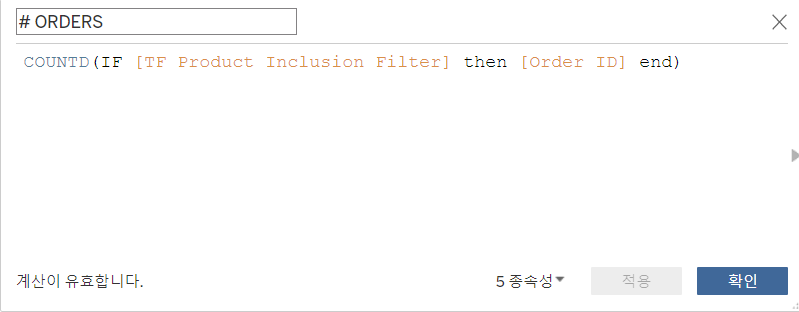
- Create a set of BANs that shows
- Total orders that meet the filter requirements
- % of total orders that meet the filter requirements

- Average order amount of those that meet the filter requirements

- Average order quantity of those that meet the filter requirements

최종 만들어진 Bans - 서식 기능이 Tableau Public에서는 부족해서 위아래 표가 생성되지 않는다.

완성된 대시보드

- Match formatting and tooltips
- Font = Tableau Regular
- Colors = Nuriel Stone
toopltips에 글씨뿐만 아니라 표나 그래프 등 다양하게 첨부시킬 수 있다. 그래서 새로운 시트로 quantity와 sales정보가 포함되어있는 그래프를 만든 후 도구설명에 포함시켰다.


https://public.tableau.com/shared/2N2HJF8TC?:display_count=n&:origin=viz_share_link
week10
week10
public.tableau.com