[시각화 스터디] 2021 Week 05 Tableau : Can You Predict the Future?
작성자: 15기 최민경
https://www.workout-wednesday.com/2021/02/02/2021w05tab/
#WOW2021 W05: Can You Predict the Future? – Workout Wednesday
For this week’s challenge, we wanted to hit two birds with one stone: try out a new feature from the Tableau 2020.4 and celebrate Black History Month with an interesting dataset on Historical Black Colleges and Universities (HBCU). Predictions, table cal
www.workout-wednesday.com
1. 데이터 소개

HBCU(Historical Black Colleges and Universities)의 등록 학생 수 자료이다. 이 자료 중 Total Enrollment와 Total enrollment of Black Students 자료만을 사용해 그래프를 만든다.
2. 분석목표
tableau의 예측 기능을 활용하여 주어진 2018년까지의 데이터를 바탕으로 2023년까지의 학생 수를 예측하는 그래프를 만드는 것이 목표다!
3. Requirements를 바탕으로 구현 방법 설명
- Create a view that shows the actuals (1993-2018) and predicted values (through 2023) for the measure selected by the user
- Measures: Total Enrollment (All Students), % of Black Students Enrolled, % of Non-Black Students Enrolled
1) 그래프에 나와야 하는 '% of Black Students', '% of NonBlack Students', 'Total Enrollment'에 해당하는 계산된 필드 만들기

2) 매개변수(parameter) 만들기
매개변수를 통해 표시할 그래프를 선택할 수 있도록 한다.
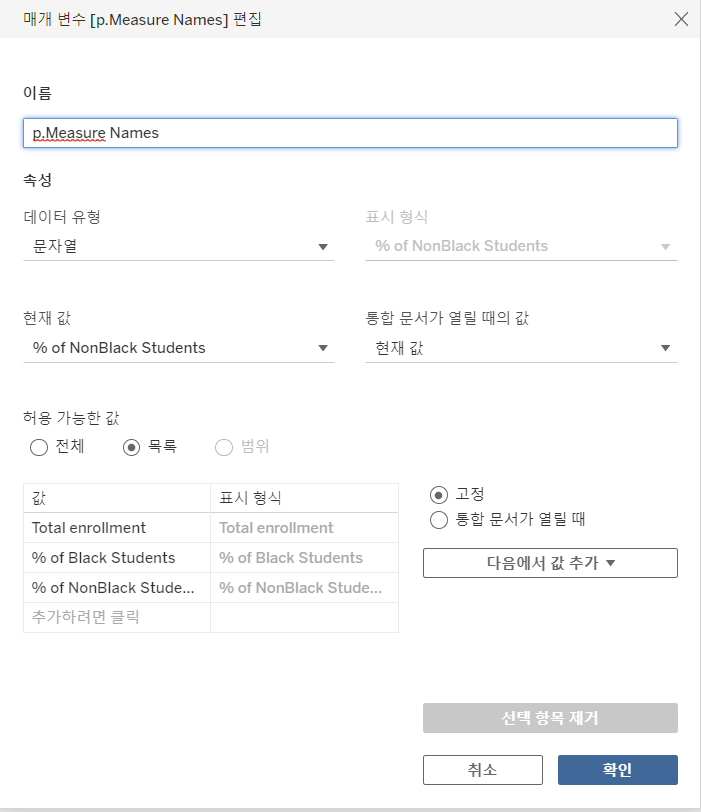

3) 매개변수를 바탕으로 화면에 표시될 자료를 정하는 새로운 계산된 필드 만들기 - 그래프에서 행에 위치

4) Year1을 통해 날짜 범위 연장하기

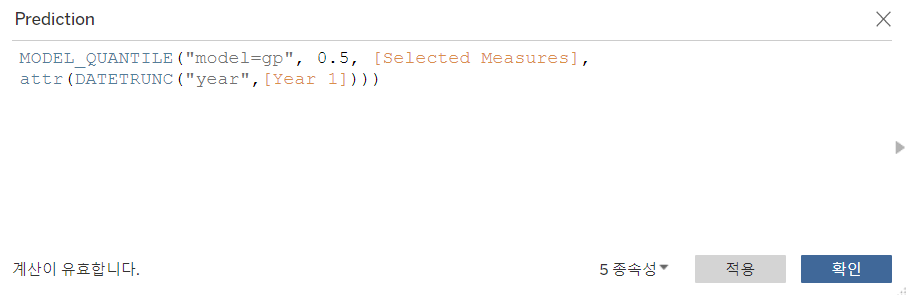
5) 새로운 계산된 필드인 Prediction 만들어 그래프에 행에 위치시켜 이중축으로 설정하기
Model_Quantile() 함수를 사용해서 중앙값(0.5)을 예측값으로 정한다.
- Dashboard Size: 1200 X 600
- Number of Sheets: 2
- Color
- Actuals Area chart: #00a2b3, opacity: 75%
- Prediction Values Line Chart: #5c6068
- Selection Options: #00a2b3

- No drop-down menus or hard-coded years in calculations
- Match tooltips and number formatting
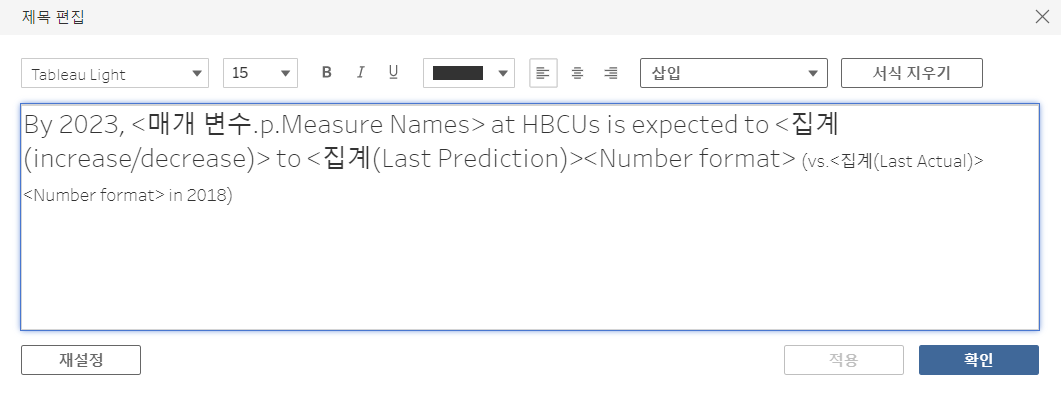
1) Title 만들기
새로운 계산된 필드 Last Actual, Last Prediction, increase/decrease, Number Format 만들기
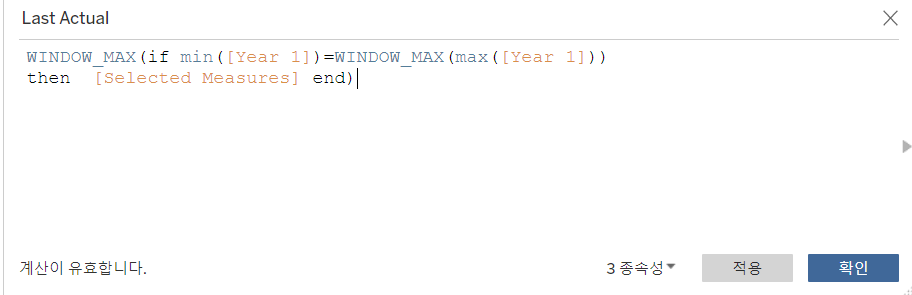


새로운 필드를 바탕으로 제목 설정하기
2) Tooltips 설정하기


3) Selection option을 위한 표 만들기

4. 완성된 대시보드
week5
week5
public.tableau.com